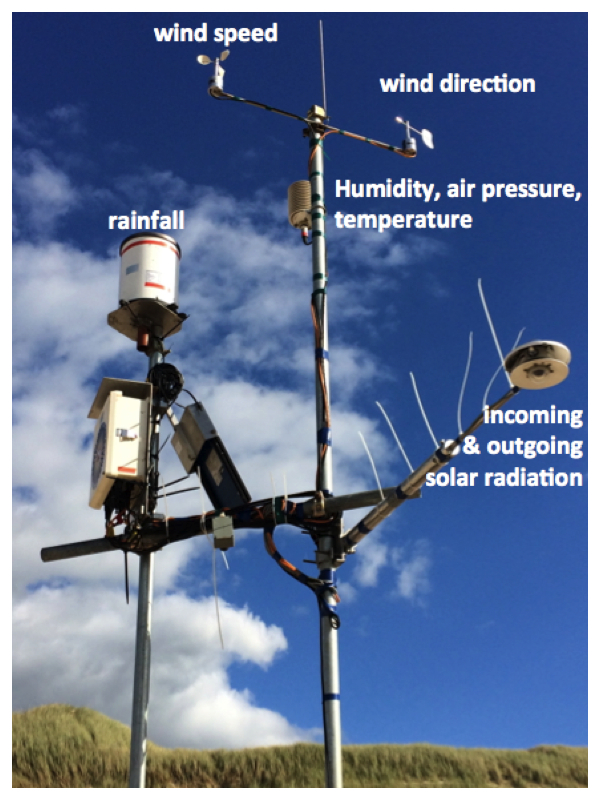
I am afraid that Aeolus didn't show up a lot the last few weeks. The wind was weak and often blowing from the east, which is not the kind of weather we are looking for. There was no need to set up any sand catchers or saltation sensors, but we still had some instruments that could prove themselves useful. There might be little wind, but that's good enough for our sonic anemometers! These instruments measure the wind direction and velocity by using sound. Sonic pulses travel between a pair of transducers and the time it takes to get from one to the other is used to determine wind speed.
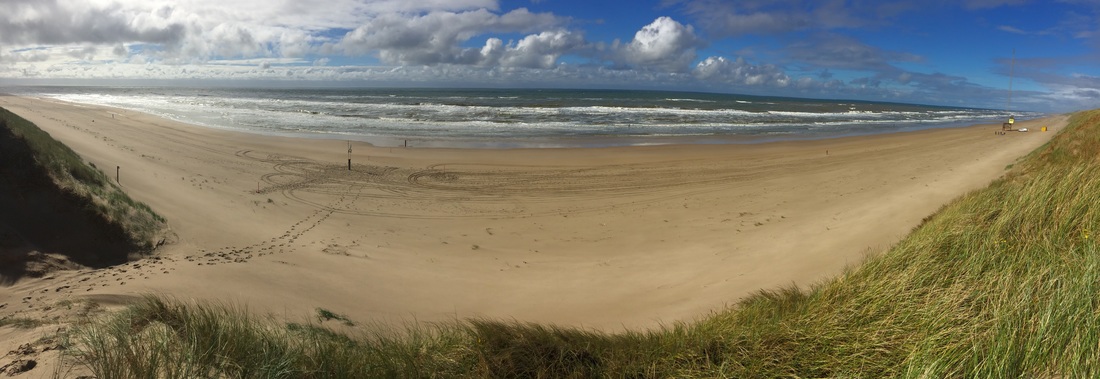
The wind - and therefore sand transport - can get affected by the local topography; in this case, the dunes. It's possible for the wind to change direction when it hits a 'wall' like that, or create vortexes when it flows over it. If the wind changes direction, then the transported sand will do that too, which is why we want to know the details of this phenomena.
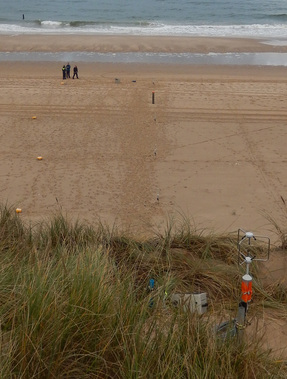
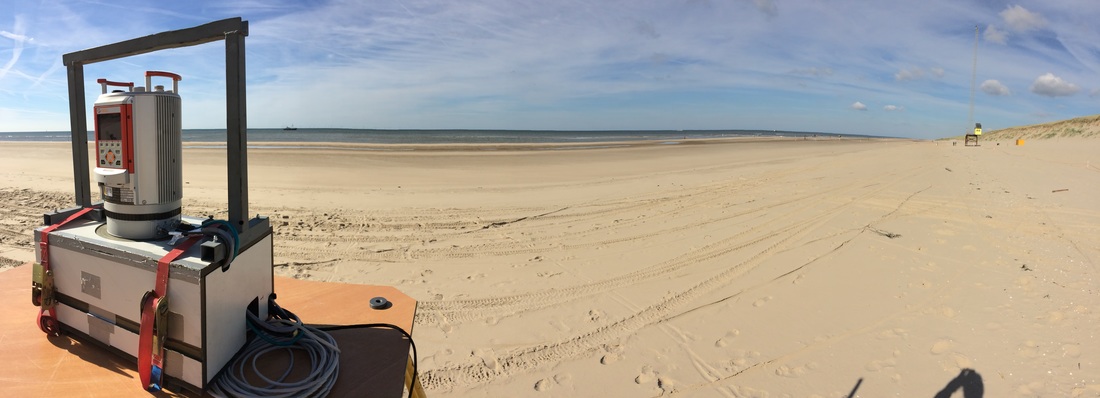
We have six sonic anemometers in total. They were placed in a row from the dunes to the sea. One was standing on top of the dune, one at the dune foot, and four on the beach itself. We left them there for a couple of hours, while we were waiting for the wind to pick up...
... Until the 21st of October. That day came with we were hoping for. Finally, we had wind!
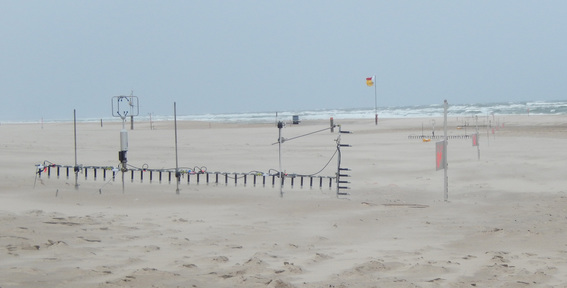
This was the first time all our aeolian transport equipment was set up on the beach; seventeen vanes with sand catchers and four frames with saltation sensors - quite an impressive sight! We even had to pay attention to where we put your feet, since we didn't want to disturb the beach too much. Leaving footprints can affect the sediment transport, so walking in front of our instruments was an absolute no-go!
 RSS Feed
