 Using millions of images and machine learning, Orbital Insight will be able to estimate global oil surpluses, weeks ahead of existing techniques, by analysing the shadows on the floating lids of oil tanks.
 Blog post by Brian Dermody - Postdoc
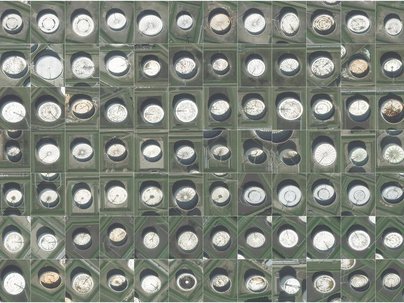
I read an article recently about a project called Orbital Insight. This is an idea to use recent, high resolution satellite imagery in addition with image recognition software to provide an up-to-date, global picture of everything from crop yields to oil surpluses (indicated by the shape of shadows on floating lids of oil tanks). The idea is that with the vast amounts of data now available and computing power to process it we can gain unprecedented insights about our planet. The founder of orbital insight, James Crawford, likened these advances to a “macroscope” that could impact our understanding of the world to a similar degree that the microscope did.
I read an article recently about a project called Orbital Insight. This is an idea to use recent, high resolution satellite imagery in addition with image recognition software to provide an up-to-date, global picture of everything from crop yields to oil surpluses (indicated by the shape of shadows on floating lids of oil tanks). The idea is that with the vast amounts of data now available and computing power to process it we can gain unprecedented insights about our planet. The founder of orbital insight, James Crawford, likened these advances to a “macroscope” that could impact our understanding of the world to a similar degree that the microscope did.
Much of these kinds of data are now openly available via the Google Earth Engine. This is a web-hosted GIS platform that exploits Googles’ ability to access pretty much any online datasets from Landsat imagery to sea surface temperature from NOAA. A high profile use of the tool recently was a paper in Science that showed global trends in deforestation and afforestation. I’d encourage anyone with an interest in these kind of datasets to go have a play. There are some nice examples of the kinds of analysis you can do on the homepage. Within the data catalog you can simply search for whichever dataset you wish to view. I searched for light and could view the DMSP-OLS Nighttime Lights Time Series. Interesting to see the big change in regions such as the Yangtze River delta! In order to have full access to all the functionality you need to apply for access as a developer. Have fun!
 RSS Feed
